Monitoring performance v10
PEM enables you to implement enterprise-wide performance monitoring of all managed servers.

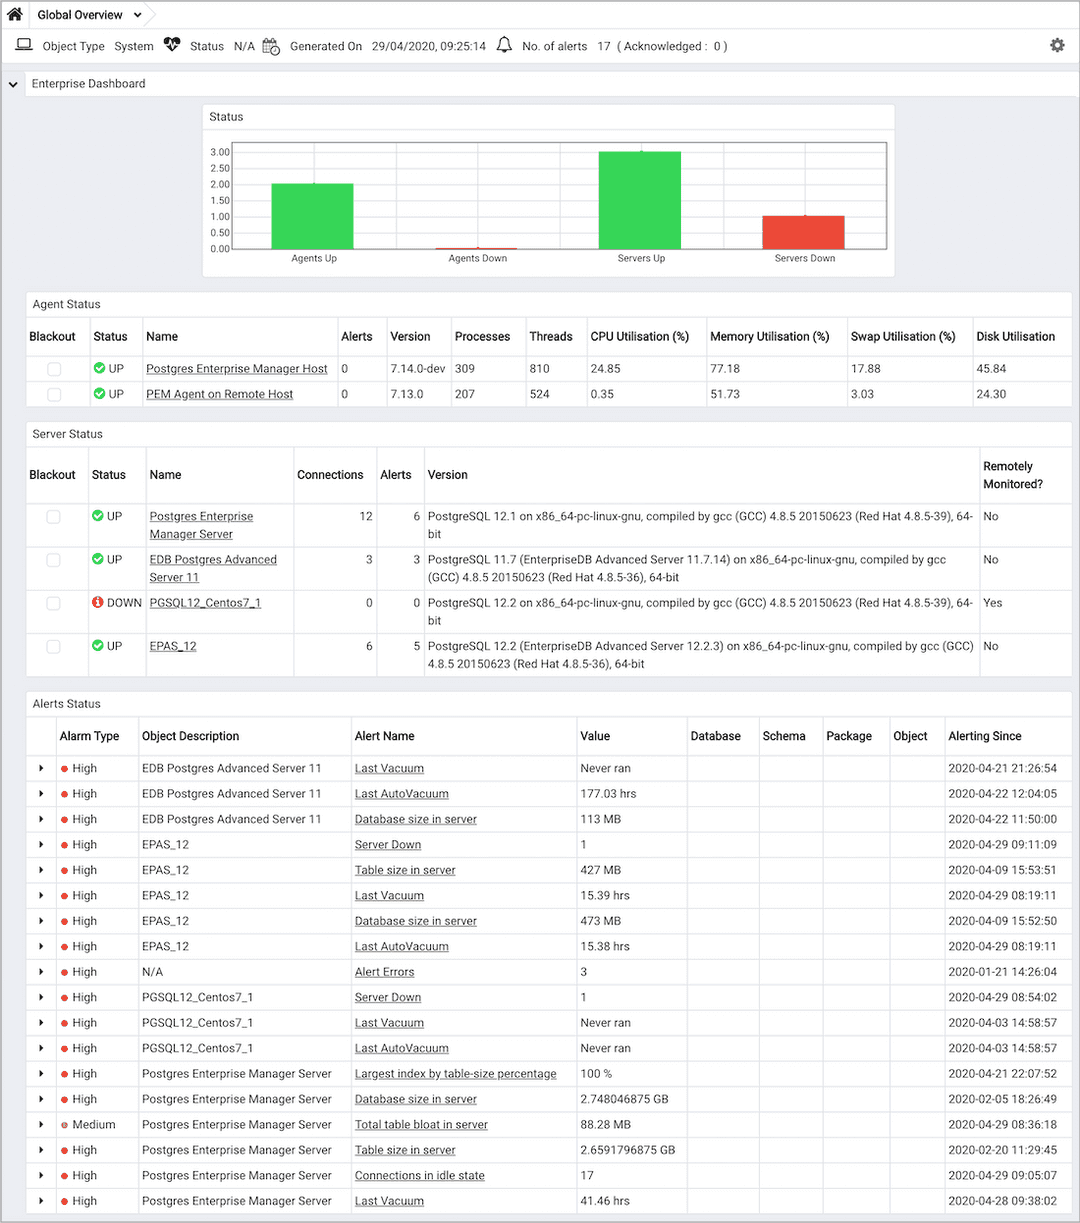
The top-level dashboard is Global Overview. The Global Overview dashboard presents a status summary of all the servers and agents that are being monitored by the PEM server, a list of the monitored servers, and the state of any currently triggered alerts.
PEM provides a number of benefits not found in any other PostgreSQL management tool:
Management en masse design — PEM is designed for enterprise database management and is built to tackle the management of large numbers of servers across geographical boundaries. Global dashboards visually keep you up to date on the up/down/performance status of all your servers.
Distributed architecture — The PEM architecture maximizes the ability to gather statistical information and to perform operations remotely on machines regardless of operating system platform.
Graphical administration — All aspects of database administration can be carried out in the PEM client using a graphical interface. You can handle server startup and shutdown, configuration management, storage and security control, object creation, performance management, and more from a single console.
Full SQL IDE — PEM contains a robust SQL integrated development environment (IDE) that provides ad hoc SQL querying, stored procedure/function development, and a graphical debugger.
Enterprise performance monitoring — PEM provides enterprise-class performance monitoring for all managed database servers. Lightweight and efficient agents monitor all aspects of each database server’s operations as well as each machine’s underlying operating system. They provide detailed statistics to easily navigate performance pages in the interface.
Proactive alert management — PEM lets you create performance thresholds for each key metric, such as memory and storage, that are monitored around the clock. Any threshold violation results in an alert sent to a centralized dashboard that communicates the nature of the problem and the actions needed to prevent the situation from jeopardizing the overall performance of the server.
Simplified capacity planning — All key performance-related statistics are collected and retained for a specified period in the PEM repository. The Capacity Manager utility allows you to select various statistics and perform trend analysis to understand things such as peak load periods and storage consumption trends. A forecasting mechanism in the tool allows you to also forecast resource usage so you can plan and budget accordingly.
Audit Manager — Audit Manager configures audit logging on EDB Postgres Advanced Server instances. You can log activities such as connections to a database, disconnections from a database, and the SQL statements run against a database. You can then use the Audit Log dashboard to filter and view the log.
Log Manager — The Log Manager wizard configures server logging parameters with (optional) log collection into a central table. Use the wizard to specify your preference for logging behaviors such as log file rotation, log destination, and the error message severity. Use the Server Log dashboard to filter and review the collected server log entries.
SQL workload profiling — PEM contains a SQL profiling utility that allows you to trace the SQL statements that are executed against one or more servers. SQL profiling can be done either in an ad hoc or scheduled manner. You can then filter captured SQL statements so you can easily identify and tune SQL statements that are running poorly.
Streaming replication monitor — You can monitor the Streaming Replication dashboard or use options on the PEM client to promote a replica node to the primary node.
Secure client connectivity — PEM supports secure client connections through an encrypted SSH tunnel. The full-featured PEM client includes an SSH Tunnel definition dialog box that allows you to provide connection information for a secure connection.
Wide platform support — PEM supports most major Linux and Windows platforms.