Using the Query tool v10
PEM contains a feature-rich interactive development environment (IDE) that allows you to issue ad hoc SQL queries against Postgres servers.
You can access the Query tool by selecting Tools > Query tool or through the context menu of select nodes of the Browser tree. The Query tool allows you to:
- Issue ad hoc SQL queries.
- Execute arbitrary SQL commands.
- Edit the result set of a SELECT query if it's updatable.
- Configure and display current connection and transaction status.
- Save the data displayed in the output panel to a CSV file.
- Review the execution plan of a SQL statement in either text, graphical, or table format (similar to https://explain.depesz.com).
- View analytical information about a SQL statement.
The Query tool features two panels:
The upper panel displays the SQL editor. You can use the panel to enter, edit, or execute a query. It also shows the History tab, which you can use to view the queries that ran in the session. You can use the scratch pad to hold text snippets during editing.
To reopen a closed scratch pad or open a new one, right-click the SQL editor and select Add Panel. You can also open new scratch pads from other panels using the same technique.
The lower panel displays the Data Output panel. The tabbed panel displays:
- The result set returned by a query
- Information about a query's execution plan
- server messages related to the query's execution
- Any asynchronous notifications received from the server.
The Query tool toolbar
The toolbar uses context-sensitive icons that provide shortcuts to frequently performed tasks.
| Icon | Behavior | Shortcut |
|---|---|---|
| Open File | Display a previously saved query in the SQL editor. | Accesskey + O |
| Save | Save a query or access the Save menu: - Select Save to save the selected content of the SQL editor panel in a file. - Select Save As to open a new browser dialog box and specify a new location to save the selected content of the SQL editor panel. | Accesskey + S |
| Save Data Changes | Save the data changes (insert, update, or delete) in the Data Output Panel to the server. | F6 |
| Find | Search, replace, or navigate the code displayed in the SQL editor: - Select Find to provide a search target and search the SQL editor contents. - Select Find next to locate the next occurrence of the search target. - Select Find previous to move to the last occurrence of the search target. - Select Pesistent find to identify all occurrences of the search target in the editor. - Select Replace to locate and replace (with prompting) individual occurrences of the target. - Select Replace all to locate and replace all occurrences of the target in the editor. - Select Jump to navigate to the next occurrence of the search target. | Cmd+F Cmd+G Cmd+Shift+G Cmd+Shift+F Alt+G |
| Copy | Copy the content that's currently highlighted in the Data Output panel when in View/Edit data mode. | Accesskey + C |
| Paste | Paste a copied row into a new row when in View/Edit data mode. | Accesskey + P |
| Delete | Mark selected rows for deletion. Select Save Data Changes to update the content with your deletions. | Accesskey + D |
| Edit | Use options on the Edit menu to access text editing tools. The options operate on the text displayed in the SQL editor panel when in Query tool mode: - Select Indent Selection to indent the currently selected text. - Select Unindent Selection to remove indentation from the currently selected text. - Select Inline Comment Selection to enclose any lines that contain the selection in SQL-style comment notation. - Select Inline Uncomment Selection to remove SQL-style comment notation from the selected line. - Select Block Comment to enclose all lines that contain the selection in C-style comment notation. This option acts as a toggle. | Tab Shift+Tab Cmd+/ Cmd+. Shift+Cmd+/ |
| Filter | Set filtering and sorting criteria for the data when in View/Edit data mode. Select the down arrow to access other filtering and sorting options: -Select Sort/Filter to open the sorting and filtering dialog box. - Select Filter by Selection to show only the rows containing the values in the selected cells. - Select Exclude by Selection to show only the rows that don't contain the values in the selected cells. - Select Remove Sort/Filter to remove any previously selected sorting or filtering options. | Accesskey + F |
| Limit Selector | Set a value for the maximum number of rows in a dataset. | Accesskey + R |
| Stop | Cancel the currently running query. | Accesskey + Q |
| Execute/Refresh | Execute or refresh the query selected in the SQL editor panel. Select the down arrow to access other execution options: - Select Auto-Rollback to roll back a transaction in case an error occurs during the transaction. - Select Auto-Commit to commit each transaction. Any changes made by the transaction are visible to others and durable in the event of a crash. | F5 |
| Explain | View an explanation plan for the current query. The result of EXPLAIN is displayed graphically on the Explain tab of the output panel and in text form on the Data Output tab. | F7 |
| Explain analyze | Invoke an EXPLAIN ANALYZE command on the current query. From the Explain Options menu:- Select Verbose to display more information about the query plan. - Select Costs to include information on the estimated startup and total cost of each plan node as well as the estimated number of rows and the estimated width of each row. - Select Buffers to include information on buffer usage. - Select Timing to include information about the startup time and the amount of time spent in each node of the query. - Select Summary to include the summary information about the query plan. | |
| Commit | Commit the transaction. | Shift+CTRL+M |
| Rollback | Roll back the transaction. | Shift+CTRL+R |
| Clear | Use options on the Clear menu to erase display contents: - Select Clear Query Window to erase the content of the SQL editor panel. - Select Clear History to erase the content of the History tab. | Accesskey + L |
| Download as CSV | Download the result set of the current query to a comma-separated list. You can specify the CSV settings through the Preferences -> SQL editor -> CSV output dialog box. | F8 |
| Macros | Create, edit, or clear the macros by selecting Manage Macros. |
The SQL editor panel
The SQL editor panel is a workspace where you can manually provide a query, copy a query from another source, or read a query from a file. The SQL editor features syntax coloring and auto-completion.
To use auto-complete, begin typing your query. When you want the editor to suggest object names or commands that might be next in your query, press Control+Space. For example, type \*SELECT \* FROM\* (with a trailing space), and then press Control+Space to select from a menu of auto-complete options.
After entering a query, select Execute/Refresh from the toolbar. The database server receives the complete contents of the SQL editor panel to execute. To execute only a section of the code that's displayed in the SQL editor, select the text that you want the server to execute, and select Execute/Refresh.
The message returned by the server when a command executes is displayed on the Messages tab. If the command is successful, the Messages tab displays execution details.
The Edit menu helps with code formatting and commenting:
- Use auto-indent to indent text to the same depth as the previous line by pressing Return.
- Block indent text by selecting two or more lines and pressing Tab.
- Implement or remove SQL-style or toggle C-style comment notation within your code.
You can also drag certain objects from the tree to save time spent typing long object names. Text containing the object name is fully qualified with the schema name. Double quotes are added if required. For functions and procedures, the function name along with parameter names are pasted into the Query tool.
The Data Output panel
The Data Output panel displays data and statistics generated by the most recently executed query.
Data Output tab
The Data Output tab displays the result set of the query in a table format. You can:
- Select and copy from the result set.
- Use the Execute/Refresh options to retrieve query execution information and set query execution options.
- Select Download as CSV to download the content of the Data Output tab as a comma-delimited file.
- Edit the data in the result set of a
SELECTquery if it's updatable.
A result set is updatable if:
- All columns are either selected directly from a single table or they aren't actually a table column (for example, the concatenation of two columns). You can edit only columns that are selected directly from the table. Other columns are read-only.
- All the primary key columns or OIDs of the table are selected in the result set.
Any columns that are renamed or selected more than once are also read-only.
Note
To work with an updatable query result set, you must have psycopg2 driver version 2.8 or later installed.
Editable and read-only columns are identified using pencil and lock icons in the column headers.
An updatable result set is similar to the data grid in View/Edit Data mode, and you can modify it in the same way.
If auto-commit is off, data changes are made as part of the ongoing transaction. If no transaction is ongoing, a new one is started. The data changes aren't committed to the database unless the transaction is committed.
If any errors occur while saving (for example, trying to save a NULL into a column with a NOT NULL constraint), the data changes are rolled back to a savepoint to ensure any previously executed queries in the ongoing transaction aren't rolled back.
All rowsets from previous queries or commands that are displayed in the Data Output panel get discarded when you invoke another query. Open another Query tool browser tab to keep your previous results available.
Explain tab
To generate the Explain or Explain Analyze plan of a query, select Explain or Explain Analyze in the toolbar.
You can select more options related to Explain and Explain Analyze from the menu.
Note
PEM generates the Explain Analyze plan in JSON format.
On successful generation of an Explain plan, three tabs/panels appear under the Explain panel.
Graphical tab
To download the plan as an SVG file, select Download in the top-left corner of the Explain canvas. Download as SVG isn't supported on Internet Explorer.
The query plan that accompanies Explain Analyze is available on the Data Output tab.
Analysis tab
The Analysis tab shows the plan details in table format, generating a format similar to the one available at explain.depsez.com. Each row of the table represents the data for an Explain Plan node. The output can contain the node information, exclusive timing, inclusive timing, actual versus planned rows, actual rows, planned rows, or loops. Child rows of the selected row are marked with an orange dot.
If the percentage of the exclusive/inclusive timings of the total query time is:
Greater than 90, red appears
Greater than 50, orange appears
Greater than 10, yellow appears
If the planner has misestimated the number of rows (actual verse planned) by:
10 times, yellow appears
100 times, orange appears
1000 times, red appears
Statistics tab
The Statistics tab displays information in two tables:
- Statistics per Node Type tells you how many times each node type was referenced.
- Statistics per Table tells you how many times each table was referenced by the query.
Messages tab
Use the Messages tab to view information about the most recently executed query. If the server returns an error, the error message appears on the Messages tab, and the syntax that caused the error is underlined in the SQL editor. If a query succeeds, the Messages tab shows how long the query took to complete and how many rows were retrieved.
Notifications tab
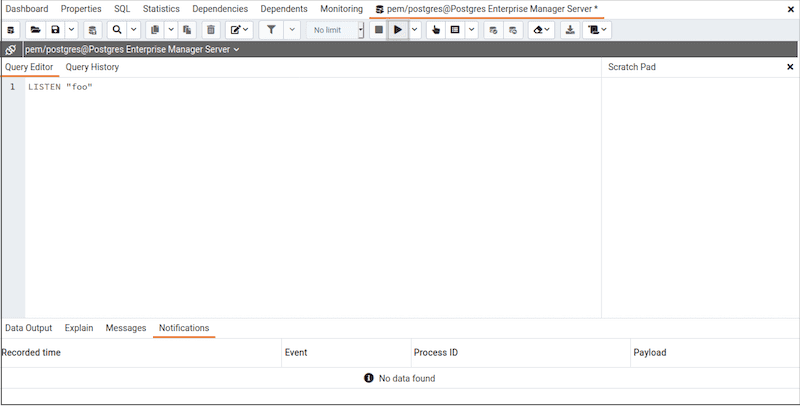
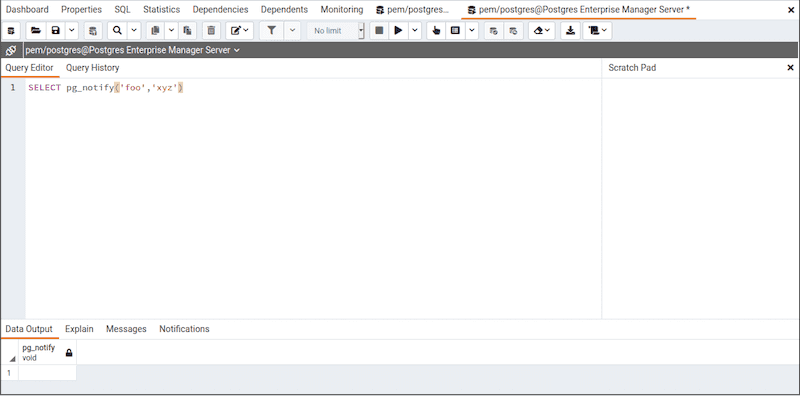
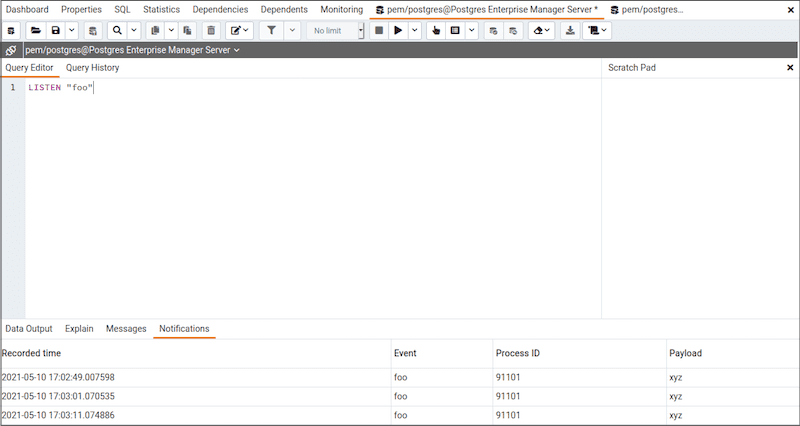
Use the Notifications tab to view the notifications using the PostgreSQL Listen/Notify feature. For more details, see the PostgreSQL documentation.
For example:
- Execute
LISTEN "foo"in first Query tool session.

- In the another Query tool session, execute the
Notifycommand orpg_notifyfunction to send the notification of the event together with the payload.

- You can observe the Notification tab in the first Query tool session where it shows the recorded time, event, process ID, and the payload of the channel.

Query History panel
Use the Query History tab to review activity for the current session. The Query History tab displays information about recent commands including:
- The date and time that a query was invoked.
- The text of the query.
- The number of rows returned by the query.
- The amount of time it took the server to process the query and return a result set.
- Messages returned by the server (not noted on the Messages tab).
- The source of the query (indicated by icons corresponding to the toolbar).
You can show or hide the queries generated internally by pgAdmin (during View/Edit Data or Save Data operations).
To erase the content of the Query History tab, select Clear > Clear history.
Query history is maintained across sessions for each database on a per-user basis when running in Query tool mode. In View/Edit Data mode, history isn't retained. By default, the last 20 queries are stored for each database. You can adjust this in config_local.py by overriding the MAX_QUERY_HIST_STORED value.
Connection status
Use Connection Status to view the current connection and transaction status by selecting the status in the Query tool.

Macros
Query tool macros enable you to execute predefined SQL queries by pressing a single key. Predefined queries can contain the placeholder $SELECTION$. When the macro executes, the placeholder is replaced with the currently selected text in the Query Editor pane of the Query tool.
To create a macro:
- In the Query tool, select Macros > Manage Macros.
- Select the key you want to use. Enter the name of the macro and the query.
- Optionally, include the selection placeholder.
- Select Save.
To clear a macro, in the Manage Macros dialog box, select the macro and select Clear. Respond Yes to the prompt.
To clear all macros, select Clear next to Key. Respond Yes to the prompt.
To execute a macro, select the shortcut keys, or select it from the Macros menu.